Understanding noise figure in RF systems
Modern receiving systems, be they satellite TV set-top boxes or mobile phones in low coverage areas, are increasingly required to capture and process very weak signals. The challenge for these systems is to do so despite the noise the signals pick up in the atmosphere, and from the receivers’ own electronics. Giovanni D’Amore, Marketing Brand Manager, Keysight Technologies explains.
One of the best ways of understanding the impact of noise in a system is to focus on a characteristic called ‘noise figure’, which can be used to measure how much noise each component in a system, as well as the overall system, creates. Noise figure is widely used to compare the noise performance of various aspects of a system, such as amplifier designs or transistor types.
Controlling the noise figure of a receiver is important, because it is usually more cost effective to do this than increase the broadcast signal power or the size of the receiving antenna to achieve the same signal to noise (S/N) ratio. For example, reducing the noise figure of the low noise amplifier (LNA) used in a satellite receiver by 1dB has about the same effect as increasing the diameter of its antenna by 40%, with all its attendant cost and mounting issues.
The output S/N ratio of a receiver depends on the input S/N ratio and the noise figure. In terrestrial systems, the input S/N ratio is a function of the transmitted power, transmitter antenna gain, atmospheric transmission coefficient, atmospheric temperature, receiver antenna gain and receiver noise figure. Lowering the noise figure of the receiver has the same effect on the output S/N ratio as improving any of these quantities.
Controlling noise is also an important part of transmitter design, especially if a noisy base station transmitter design would degrade the S/N ratio of adjacent channels.
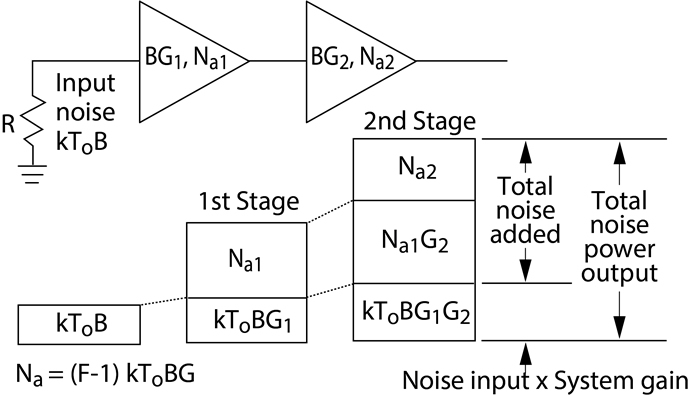
Figure 1. How noise figures are calculated in multi-stage systems
Sources of noise
Thermal noise arises from vibrations of conduction electrons and holes. The power delivered by a thermal source into an impedance matched load is kTB watts, where k is Boltzmann’s constant (1.38x10⁻²³ joule/K), T is the temperature in K, and B is the system’s noise bandwidth. The available power into a matched load is directly proportional to this bandwidth.
Shot noise arises from the quantised nature of current flow, and from phenomena such as the generation and recombination of hole/electron pairs in semiconductors, or the division of emitter current between the base and collector in transistors. These noise generating mechanisms produce equal power density across the RF and microwave frequency range.
Industry often refers to the ‘noise temperature’ of a device, Te, to represent the combined noise power of all these mechanisms as if it were a pure thermal source of that temperature.
What is a noise figure?
The basic definition of noise figure is that it is the ratio F of the input S/N ratio to the output S/N ratio, and therefore represents the degradation of the S/N ratio caused by the system through which the signal passes.
Noise figure is independent of gain, because a perfect amplifier that generates no noise would amplify noise and signal equally. In reality, almost all amplifiers add noise and the extent to which they do this is characterised by the amplifier noise figure. Noise figure is also independent of the input signal level, at least for as long as the amplifier is working linearly.
However, a system’s noise figure is dependent upon the temperature of the source that excites the network, because the noise generated by that source is usually related to its temperature. The IEEE has adopted 290K as the standard temperature at which noise figure should be determined.
Noise figure is also generally a function of frequency, but independent of bandwidth. It is commonly expressed as NF = 10 log F, where, to reiterate, F is the ratio of input to output S/Ns.
Noise characteristics of two-port networks
One reason why noise figure is such a useful measurement in design is that it can be applied to both individual components, such as a transistor amplifier, and to complete systems, such as a receiver.
The overall noise figure of the system can be calculated if the noise figures and gains of each system components are known.
In Figure 1, the output noise consists of:
- The kToB source noise (where k is Boltzmann’s constant, To is the temperature in Kelvin, and B the system’s noise bandwidth) amplified by both gains, G1 and G2.
- Plus the first amplifier’s output noise, Na1, amplified by the second gain G2.
- Plus the second amplifier’s output noise, Na2.
The noise power contributions may be added since they are uncorrelated.
It is then possible to calculate the individual amplifier noise contributions, and then express the output noise in terms of their noise factors, F. Once the output noise is known, the overall noise figure FSYS for the system can be calculated as F1 + (F2-1)/G1. The (F2-1)/G1 part of this equation is often known as the second-stage contribution to the overall system noise figure. The equation defining FSYS also shows that as long as the first-stage gain is high, the second-stage contribution will be small – which is why the gain of pre-amplifiers is so important in receiver design.
Gain and mismatch
Device gain is obviously an important part of noise calculations, but there’s a difference between an input noise power of kToB, which is the available power, and what actually gets coupled into the system, which depends on how its impedance is matched at the load. Large input mismatches reduce the power delivered to the device, and this effect can be characterised as the ratio of the power delivered into the load to the available power from the source, which is defined as transducer gain, Gt.
Available gain (Ga) is often given as a transistor parameter, and represents the gain that will result when a given source admittance, Ys, drives the device and the output is matched to the load.
Insertion gain, Gi, or the forward transmission coefficient, is the quantity specified or measured for gain in a 50ohm system. Measuring this relies upon using a measurement system with low reflection coefficients and a good output match to the device under test.
What’s important to understand here is that the matching between stages within a system affects the way power is coupled from one stage to the next and therefore the system’s overall noise performance - only when the output of one stage matches the input of the next in the same way as it was characterised can the noise figures in each stage’s specification be relied upon.
Noise parameters
A noise figure is supposed to be a simplified model of the actual noise in a system, based on a single, theoretical noise generator at each stage. Real amplifiers usually have multiple noise sources, created by thermal and shot processes, and the impact of the source impedance on these can be complex.
The noise figure that results from a noise figure measurement is influenced by how well the noise source matches to the device under test, and the match of the device under test to the measuring instrument.
Designing LNAs means understanding how the active device’s gain and noise figures change as a function of the source impedance or admittance. To fully understand the effect of mismatch in a system, both its noise figure and gain need to be characterised.
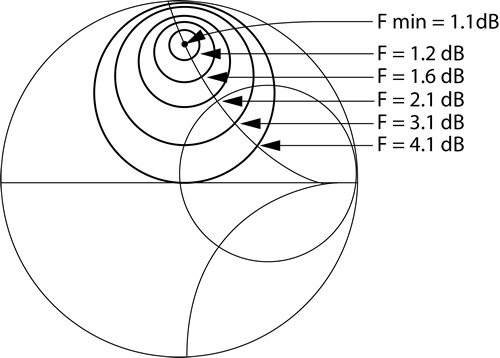
Figure 2. Noise circles relate source impedances and noise figures
A noise parameter characterisation uses a special tuner to present different complex impedances to the device under test, to derive noise factors related to the reflection coefficient of the source. It is then possible to determine the minimum noise factor (Fmin), the optimal source reflection coefficient (Γopt) that enables that minimum, and the related noise resistance (Rn), which represents the sensitivity of noise figure to source admittance changes. These quantities, two Scalar, Fmin and Rn and one vector, Γopt in magnitude and phase are frequently referred to as the ‘noise parameters’, and it is their determination which is known as ‘noise characterisation’.
When Γ, the source reflection coefficient, is plotted on a Smith chart for a set of constant noise factors, F, the result is a set of ‘noise circles’, a convenient way of displaying the complex relationship between source impedances and noise figures.
It is also possible to plot the source reflection coefficient Γ on a Smith chart for a set of fixed gains, which yields ‘gain circles’ that show the relationship between the source impedance and gain.
The effect of bandwidth
Noise figure is independent of device bandwidth. When making noise measurements, it is usually assumed that the relationship between signal frequency and amplitude in the device being tested is constant over the measurement bandwidth. This means that the noise measurement bandwidth should be less than the device bandwidth, or an error will be introduced.
Some of the higher end Keysight NFA series noise figure analysers have variable bandwidths to make measuring narrowband devices easier, as do spectrum analyser-based measurement systems. Keysight also offers a variety of other tools for making the kind of accurate, repeatable noise figure measurements that are vital to the design, manufacture and repair of advanced receiver systems.


