Debuggers replace oscilloscopes & logic analysers
As debuggers can now provide extensive and often very effective graphics processing of huge amounts of data, could they replace oscilloscopes and logic analysers?
By Jens Braunes, Software Architect, PLS Development Tools.
It is not possible to imagine the everyday life of software developers without debuggers. However, quite often only a fraction of the available functionality they provide is used. Many developers still solely bring breakpoints, single-stepping through code and observation of memory contents and variables at a specific point in time in connection with the debugger. Even though today’s high-end debuggers offer vast visualisation capabilities, particularly in the embedded sector where applications that closely interact with the outside world have to react to input values from peripherals and generate control signals. Thanks to the extended debug capabilities of many current MCU families, a large amount of data can be captured even from registers inside of the peripherals and from port pin registers. So why not use the debugger as an oscilloscope or logic analyser? What possibilities and limitations are there for this kind of application?.
Data acquisition
Oscilloscopes and logic analysers capture data and signals via probes; that is, by physical connections to open lines or pins on the target board. A debugger cannot do this, it requires a debug interface, which has to be provided by the chip manufacturer. However, there is also a clear advantage here. Whereas with probes only signal and data paths that are routed to the outside can be accessed, a debugger also enables a look inside the controller, at least, as far as the on-chip debug hardware allows.
JTAG is currently the most widely-used debug interface. The data to be displayed are serially fetched from the chip. The data transfer as well as the comparatively low JTAG clock frequency, only with a few MCUs allow up to 50MHz, limit the speed. Another restriction is caused by the overhead of the debug protocol, which takes care of capturing the requested data from the target. The sampling frequencies that are effectively achievable with JTAG are in the middle to upper kilohertz range.
On the debugger side, debug probes, such as the Universal Access Device 2 (UAD2) from PLS, ensure the necessary data rates and a periodic transfer of data between target and debugger (see image above). Low-end solutions, such as debugging via a USB 2.0 interface frequently available on evaluation boards, are completely unsuitable for this purpose. Besides JTAG, in recent years other debug interfaces have been established. Some of them allow considerably higher clock frequencies and thus also higher sampling rates.
Another possible solution to efficiently capturing the required data is trace. Here, the acquisition is handled by the controller itself or rather by the trace unit inside. In the strict sense, there is no sampling here, the recording of data is rather done at the time the data becomes available. In general, by means of trace, much higher data rates can be generated than with conventional debug interfaces; theoretically data can be captured up to the processor’s clock speed. However, the limiting factor here is the transfer of trace data to the debugger. When high volumes of data need to be captured, especially for high frequency signals, overruns of the internal trace buffers may occur. In this case, data packets must be discarded and the resulting presentation in the debugger is possibly not correct anymore.
Data presentation
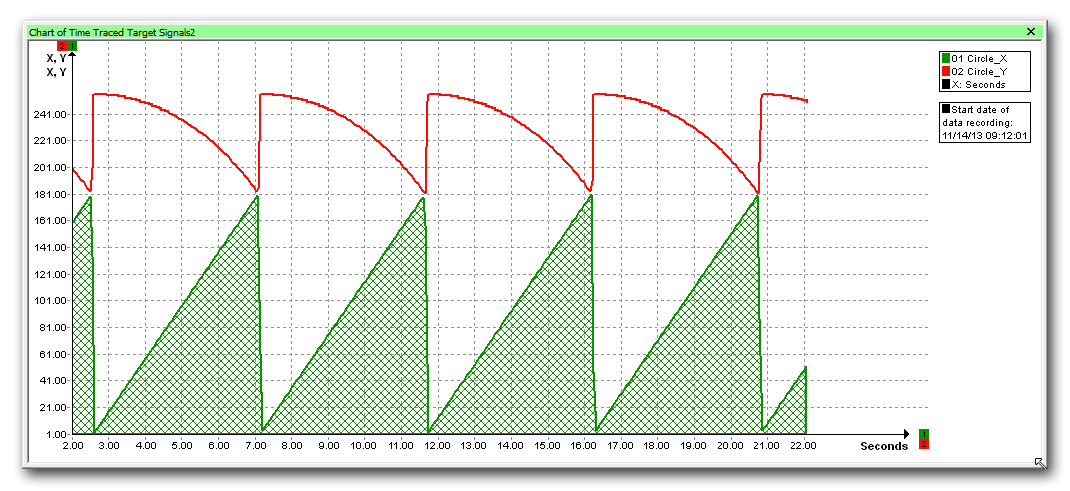
Figure 1 - Presentation of values over time
As already briefly mentioned at the beginning, in addition to the usual text-based presentations of, for example, memory dumps, watch variables or register contents, modern debuggers also offer a set range of functions for fast visualisation of the captured data. The simplest visual data presentation is a value/time diagram, where the data values are drawn on the y-axis and on the x-axis the timestamps at which the data values have been captured. In the simplest case, the system time of the PC, on which the debugger runs, could be used. However, the latency of the data transfer from the target, via the debug probe, up to the debugger on the PC hardly allows a suitable value-to-time relation. Therefore, the debug probe itself provides a timestamp, which together with the sampled data is used for the graphical presentation.
This might perhaps be sufficient for some applications if presented data are not related to an application-specific time-normal. In the vast majority of cases, however, specific signals and data are directly and closely related to a time on the target, for example, to a counter incremented by timer interrupts or even a system clock. Fortunately, such a time-normal can also be readout as easily as it is for all other target values. Only the mapping to the diagram axes has to be changed; that way the time value becomes the time reference for all real data values (Figure 1).
Is is often quite interesting to display several values from the application in one single diagram. The simplest case is an array chart. Values stored as a sequence in the memory can be shown along the x-axis. Thus, for example, a calculated characteristic curve can be presented in a simple and user-friendly way. Another very practical application is to show the binary coding of a value. Figure 2 illustrates this. The content of a port register is presented here as binary pattern.

Figure 2 - Array chart used to present individual bits of a port register
Of course presentations like those just described need a preprocessing by the debugger. Seldom data read from target can be displayed as it is. The solution for preprocessing data is called 'Expressions'. Based on raw data, expressions calculate data to be displayed at the end. Here is an example: the goal is the presentation of the output signal of a single port pin. Typically, port pins are represented by registers. In most cases, a specific bit within a register is mapped to a specific port pin. However, the debugger has access to the register only as a whole (32 bit). An expression defined in the debugger, which only masks the bit of interest, helps to realise the desired logic analyser function for the output signal of the port pin (Figure 3). Expressions provided by modern debuggers are quite as powerful as that of programming languages such as C. In addition to the presentation of the recorded data in diagrams, areas of interest can also be looked at more closely. The basic available functions include zoom, navigating in the recorded data as well as measurements with the crosshair cursor.
In general, the graphical presentation of data and signals from embedded systems is therefore not a problem for modern debuggers. However, there are also some limitations, which need to be considered when using them. An important aspect is the sampling rate. Although debug interfaces have a clear advantage over an oscilloscope or logic analyser, if chip internal signals need to be observed the sampling rate is generally comparatively low. Only trace offers sufficient capabilities to record high-frequency signals and make them visible in the debugger. However, since this is not always possible and practical, recording and analysis of high-frequency signals will likely remain a domain of laboratory equipment. But, if we focus on control algorithms with relatively low frequencies of the signals of interest, the conventional communication via the debug interface with the target is completely satisfactory in order to take a look at it with the debugger.
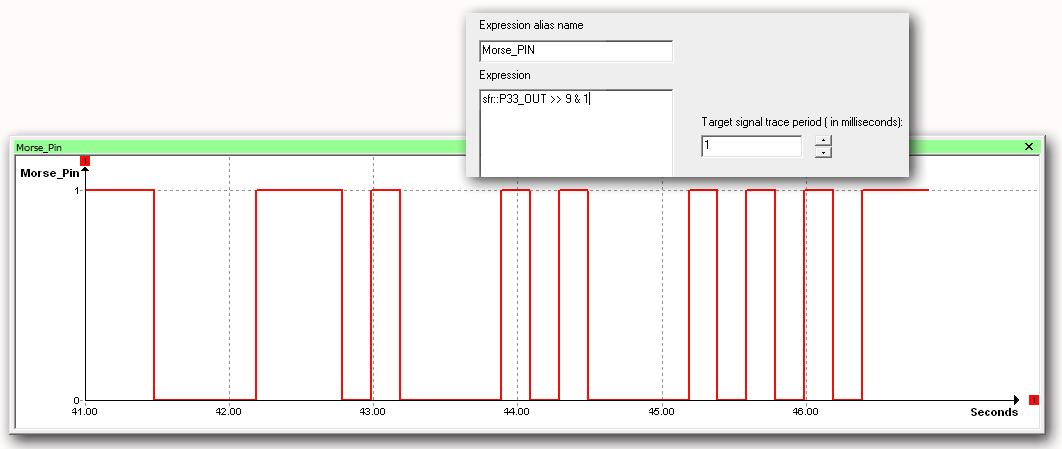
Figure 3 - An ‘expression’ extracts an individual bit from a sampled port register that is then displayed in a chart
Another important point is triggering on specific events. This is a feature oscilloscopes provide, for example, producing a stationary image of a periodic signal and also its frequency. Such functions are typically not available in a debugger; instead the focus is on the visual presentation. Nonetheless, if detailed measurements are needed, the time measurement function of the debugger can be used. With it, for example, we can measure the time difference between two breakpoints attached to interesting data accesses. Modern MCUs often provide a feature-rich trigger logic implemented within the on-chip debug system, enabling the use of similar complex trigger conditions as those available on logic analysers.
It is also necessary to bear in mind that with a logic analyser only single bit signals are observed. The Debugger on the other hand is word oriented and therefore operates with the respective bit width (8, 16, 32 or 64-bit) of the target. Hence, single bit signals have to be extracted from the captured data word at first. That is, as explained, not a big hurdle.
Almost all information needed for test and troubleshooting can now also be graphically presented using modern debuggers. Not only watch variables and their development over the time or contents of memory locations, but also register contents and complex relationships, calculated by 'expressions', can be easily visualised. Developers can get a quick overview of the signal sequence generated by the embedded application, and if access to internal signals and buses is needed the debugger shows its clear advantage over oscilloscopes and logic analysers. These signals remain hidden for the latter. However, to analyse high-frequency signals, a debugger is of limited suitability, because the maximum sampling rate is utterly too low. This is where it is much better to rely on conventional laboratory measurement equipment.

