Software brings 3D mapping to nanoscale objects
Based on Digital Surf’s Mountains Technology, AttoMap software brings 3D imaging of spectroscopic information obtained using Attolight’s CathodoLuminescence (CL) technology. This integrates a scanning electron microscope and a light microscope into high resolution spectroscopy instruments used to characterise semiconductors, solar cells and other nano devices. 3D visualisation makes it easier to locate and characterise features and defects on nanoscale objects.
The Attolight CL microscope generates images containing up to 1,600 colours. Visualising such images, called hyperspectral maps, is a real challenge since the human eye can only perceive the three primary colours, red, green and blue and mixtures of these colours.
AttoMap software brings a very powerful solution to this problem. First, it allows the user to convert relevant spectral bands into colours that he or she can perceive, such as red, green and blue. The software then automatically generates a 2D RGB image that is both friendly to the human eye and makes it easy for the user to see the location of specific spectral features. Finally, AttoMap transforms this image into a 3D map, where the third dimension corresponds to the cathodoluminescence intensity. It is a very convenient method for understanding how intense each spectral band is compared to other bands. This 3D map can be modified in real time to facilitate inspection.
In addition to processing cathodoluminescence data, AttoMap works with images and surface data from a wide range of microscopes including scanning electron microscopes, scanning probe microscopes and 3D optical profilers. It can colocalise images and data from different instruments for correlative studies. Working with measured or reconstructed 3D surface topography data it can be used for surface metrology applications, calculating areas, volumes, step heights and surface roughness parameters and carrying out 3D Fourier analysis, particles analysis, statistical analysis and more.
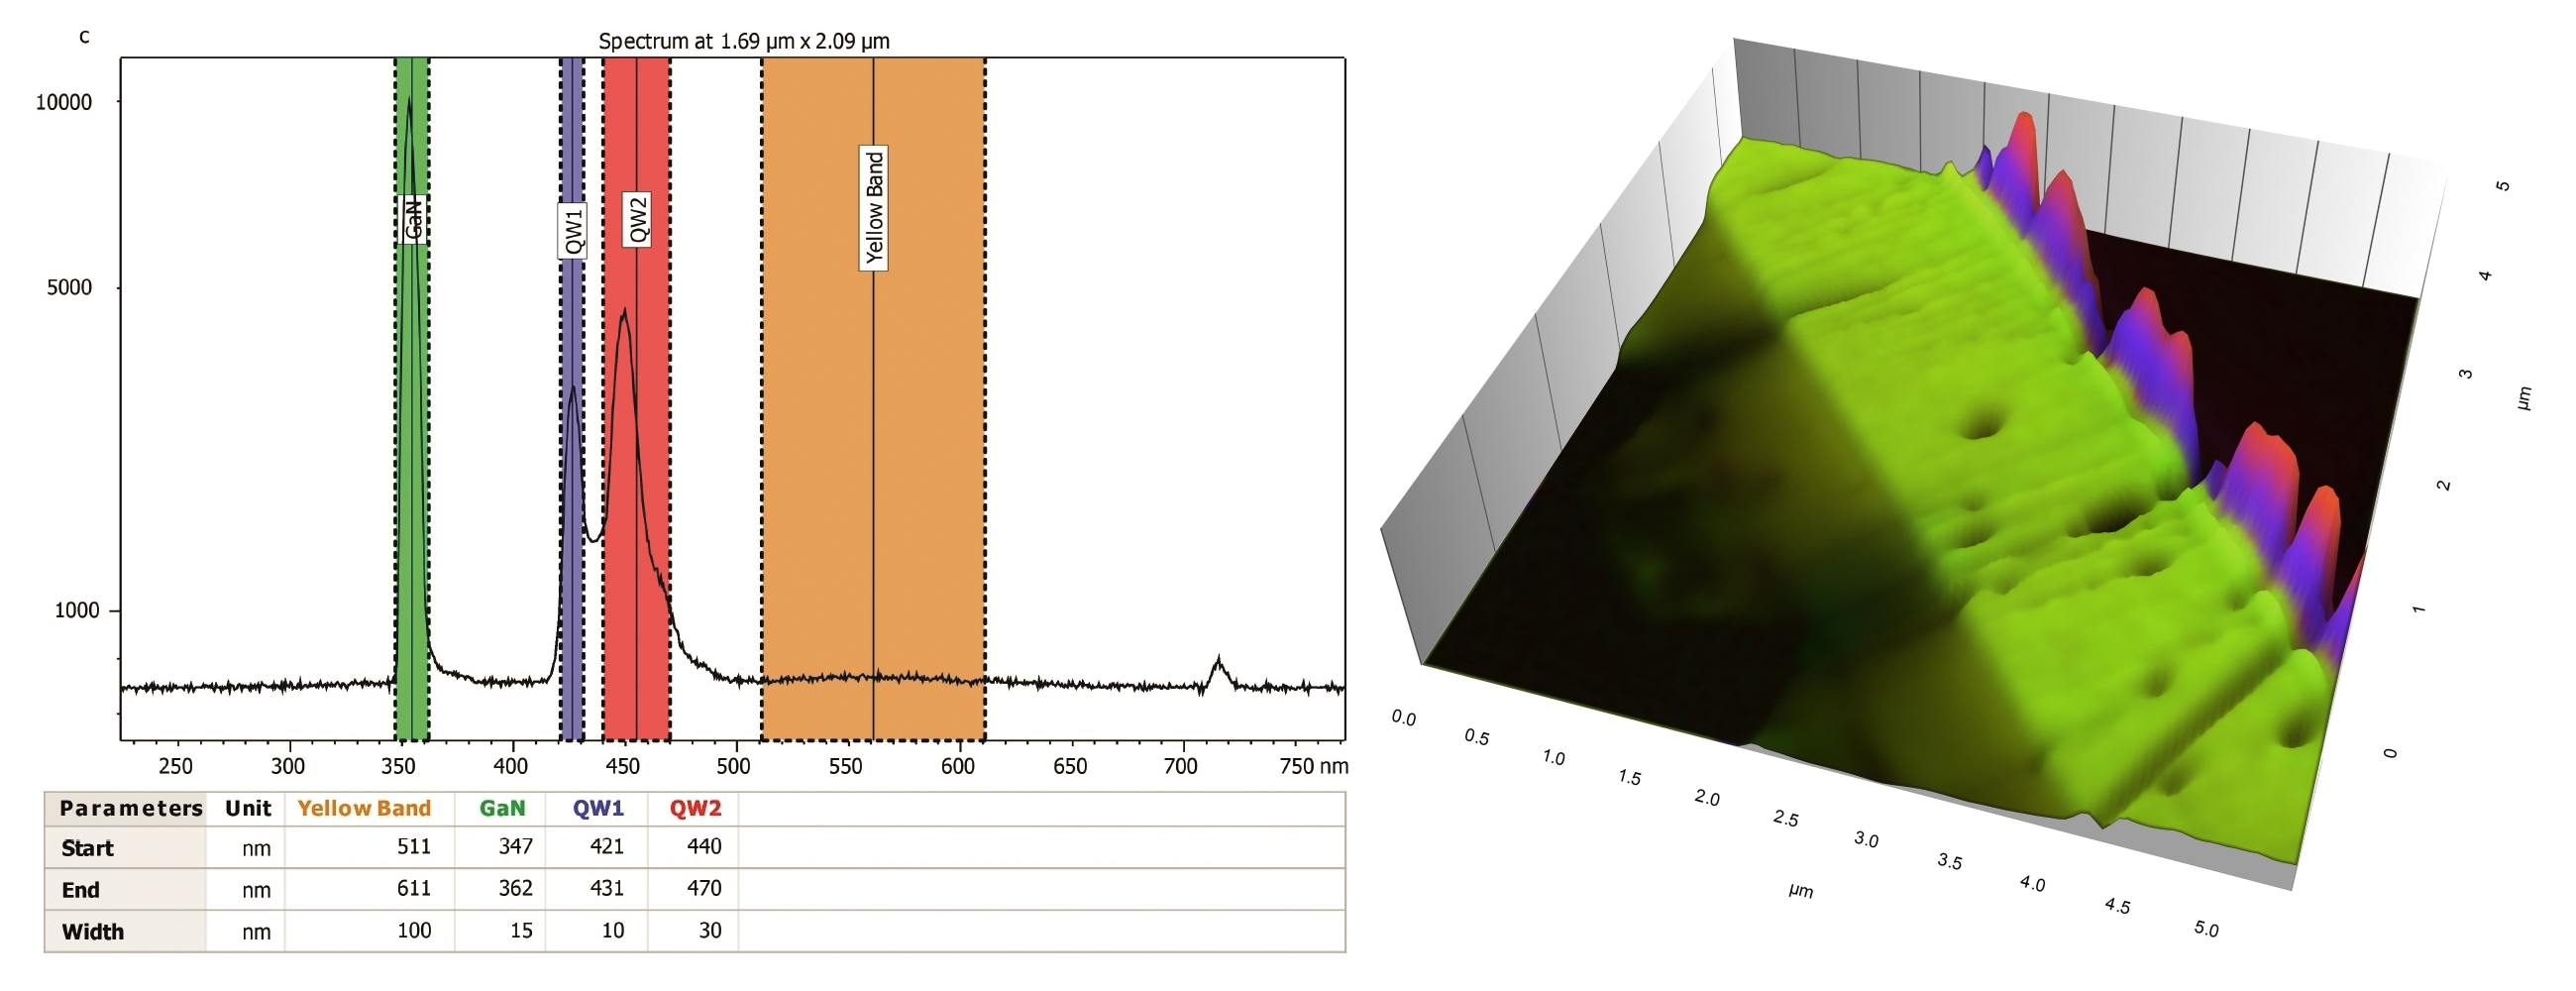
Visualisation of spectroscopic features on a GaN LED obtained by Attolight’s high resolution cathodoluminescence technology. Left: band definition in AttoMap software; each band is associated to a relevant spectral feature (band edge, quantum wells, impurities). Right: 3D image of spectroscopic bands in AttoMap.
Jean Berney, CTO, Attolight, commented: "AttoMap’s 3D visualisation of hyperspectral images is an incredible way to quickly obtain a good understanding of a cathodoluminescence data set. It further widens the gap between Attolight and its competitors by providing a superior experience from measurement to data processing. Furthermore it brings unparallelled analysis tools to correlate cathodoluminescence with complementary measurement methods such as EBIC, AFM, micro-photoluminescence or Raman.”
"Attolight is a reference in cathodoluminescence technology and Digital Surf is proud to provide AttoMap software that includes a broad range of imaging, hyperspectral analysis and surface metrology functions from our Mountains Technology software platform," added François Blateyron, COO, Digital Surf.

