Lightning research with 8-channel digitiser system
The causes of a lightning flash are complex and still unclear. At Duke University, North Carolina, USA, the team of Prof. Cummer tries to resolve these secrets.
Lightning often occurs entirely in opaque clouds which makes it impossible to see what is going on. However, a flash also produces radio waves in the UHF and VHF frequency range that can be captured and studied.
The challenge is that a huge amount of data needs to processed and recorded in the seconds before and during the lighting event. The scientists chose ADC cards by Spectrum Instrumentation to manage this challenge. The objective of the research is to understand how lightning forms, using this knowledge to better protect buildings from damage and also to understand if climate change will result in more or fewer lightning storms.
Steven A. Cummer, Professor of Electrical and Computer Engineering at Duke University explains: “A few years ago, there was nothing that could capture and process the huge volume of data involved. During an active thunderstorm, we often need to be able to record over one TeraByte per hour. We selected the Spectrum M4i.4451-x8 digitiser card with four channels, and we use two of them in the recording equipment. They are connected via Spectrum’s Star-Hub to enable us to record simultaneously from eight antennas. Star-Hub ensures that everything is perfectly in sync which is vital as we are using the antennas to form an interferometer. From small time differences between the signals at different antennas, we are able to work out the location of each lightning event which can be up to 50 kilometres away. The cards have a sampling rate of 500 MegaSamples per second on each channel to gather the amount of data we need, and the 14-bit resolution ensures we capture all the small signals.”
The important second before the lightning event
The research of Prof. Cummer is partly focussed on the moments just before and just after the lighting starts.
The structure of lightning once formed is understood – it is a conducting channel of hot ionised gas that can be hundreds of meters long.
“A challenge is that we are trying to capture data before the lightning begins. This pre-event data is virtually impossible to obtain if you rely on optical data capture of the flash as there is no easy way to gather this from back in time,” he explained. “But now, with the Spectrum-based setup, we are able to get pre-lightning data. The cards constantly record data and then overwriting if it is not needed. The lightning event is the trigger to not only record data for the next second but also keep the previous fraction of a second before the event, as that is always in the card’s memory but just not stored unless triggered. With 2 GigaSamples of memory per card, there is more than enough storage to capture all the several hundred MegaSamples of signals per second we need, which is then written to an SDD. That done, the system quickly resets to record the next lightning event’s data. This is vital to capture data from a storm where lightning can occur every few seconds for several hours.” Regarding the software of the 8-channel system, Prof. Cummer commented that he uses Spectrum’s measurement software SBench 6 to control and programme the cards. “This was so easy and versatile to use that no time in this project was needed to create special software programs from scratch,” he reports.
Lightning gamma radiation
Another mystery that Prof. Cummer and his team are investigating is why some lightning events generate high energy gamma radiation and others do not. The fact that this happens was discovered around 30 years ago. Gamma ray detectors on satellites picked up signals from Earth while scientists expected they should only come from deep space. The gamma rays in a thunderstorm are generated right at the beginning of a flash, so the pre-event data gathered on this project will enable physicists to understand this kind of gamma ray production.
An example of lightning analysis
The 8-channel system with its antennas could be moved around, but up to now it was operated in a fixed location at the Duke University in Durham. On April 12, 2019 at 21:24:40 UTC, the lightning flash analysed here was recorded. It is noteworthy that this entire flash took place inside a storm cloud, so only a diffusely illuminated cloud could be seen. But, with VHF radio measurements, the entire structure was captured which is shown in the diagram.
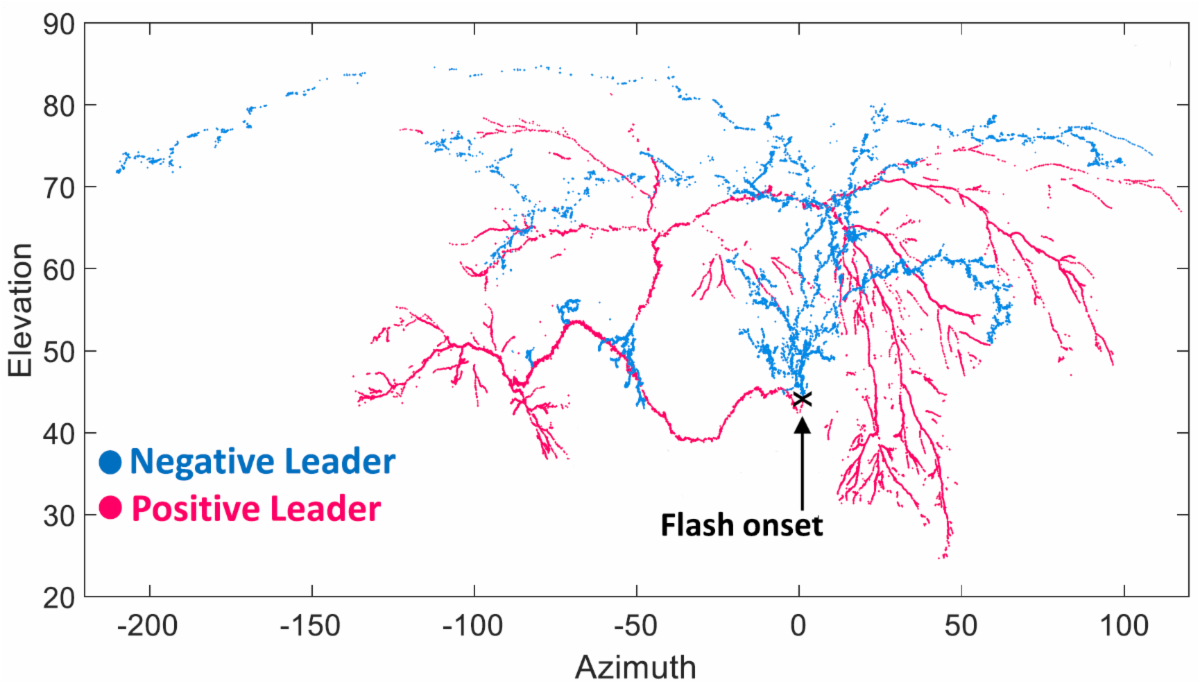
With azimuth and elevation, every position in the sky is clearly defined. The timing sequence of this lightning can be seen in the linked 48 sec video that shows in slow motion the 1 second duration lightning flash. Each dot in the movie is a different detected and located radio source from the lightning flash. When all shown together, these dots make a very clear movie of the space and time structure of the lightning event.
Video link: https://spectrum-instrumentation.com/videos/lightning.mp4
This research paper by Prof. Steven Cummer and Dr. Yunjiao Pu deeply analyses this lightning event: https://agupubs.onlinelibrary.wiley.com/doi/10.1029/2019GL085635


