Tool provides streaming trace on SEGGER J-Link
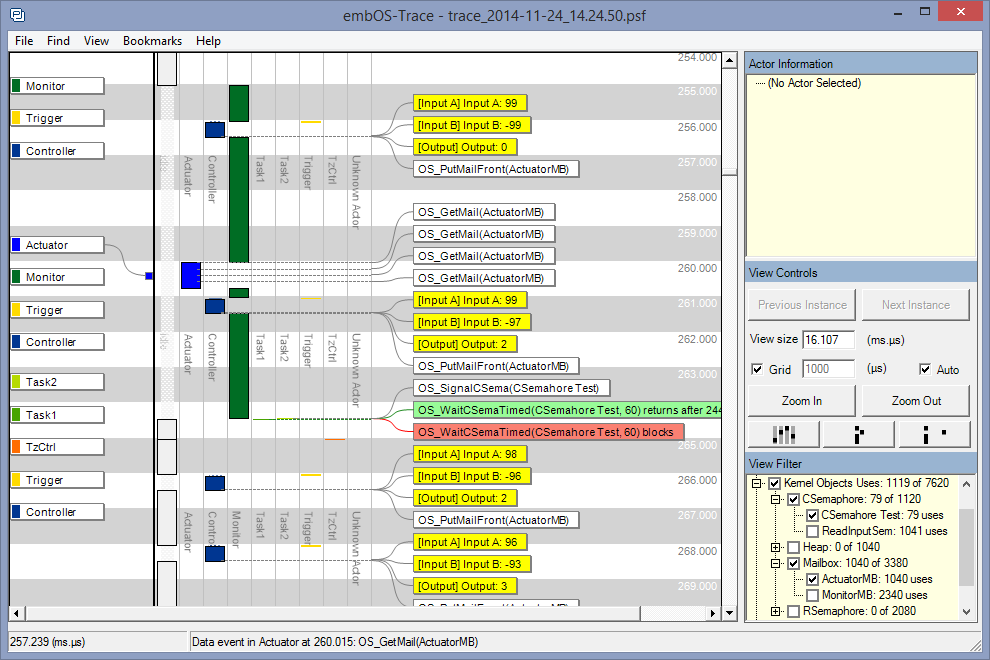
Percepio has announced embOS-Trace, a sophisticated tool offering an unprecedented insight into the runtime world for embedded software developers using SEGGER embOS and SEGGER J-Link debug probes. The insight provided facilitates debugging, validation, profiling, documentation and training. This can help avoid weeks of troubleshooting and vastly increase development speed.
The Tracealyzer tools, including embOS-Trace, leverage the high performance of SEGGER J-Link debug probes to offer continuous trace streaming of runtime events, such as scheduling, interrupt handlers, kernel calls and application events. Tracealyzer uses software-defined trace, where events are stored in a RAM buffer. This is very flexible, easy-to-use, and does not depend on hardware trace support. Moreover, in embOS-Trace the trace length is no longer limited by the available RAM. Continuous trace streaming over long sessions is now possible, requiring just a standard J-Link debug probe and a small RAM buffer of a few kilobytes.
Dr Johan Kraft, founder and CEO, Percepio, commented: “We are very satisfied with this solution. Since the SEGGER J-Link reads the trace data in the background, without disturbing the application, we can now offer a very efficient and reliable solution for unlimited RTOS trace. And it works on a standard SEGGER J-Link.”
“With the increasing complexity of embedded software, runtime visualisation is becoming a ‘must-have’ in the developers’ toolbox. Percepio offers an amazing visualisation tool that without doubt will be very useful for many embedded developers,” added Dirk Akemann, Partnership Marketing Manager, SEGGER.
This tracing technology for streaming trace is currently available in embOS-Trace and will soon be released for other Percepio Tracealyzer tools targeting other MCU OSs.

